Adding Plots to a Post
Hugo Python MatplotlibOne of the main requirements in order to publish Jupyter notebooks is to be able to attach images to the posts. In this post, I focus on how to attach images, and in finding a standard for the images (like fonts, background and style).
How to attach an image with Hugo
In order to attach an image to a post, I follow this Stackoverflow post. I create a folder for the images under the static folder:
mkdir static/images
I will store the images in this folder, and include them using the syntax:

On a fresh Ubuntu image on WSL
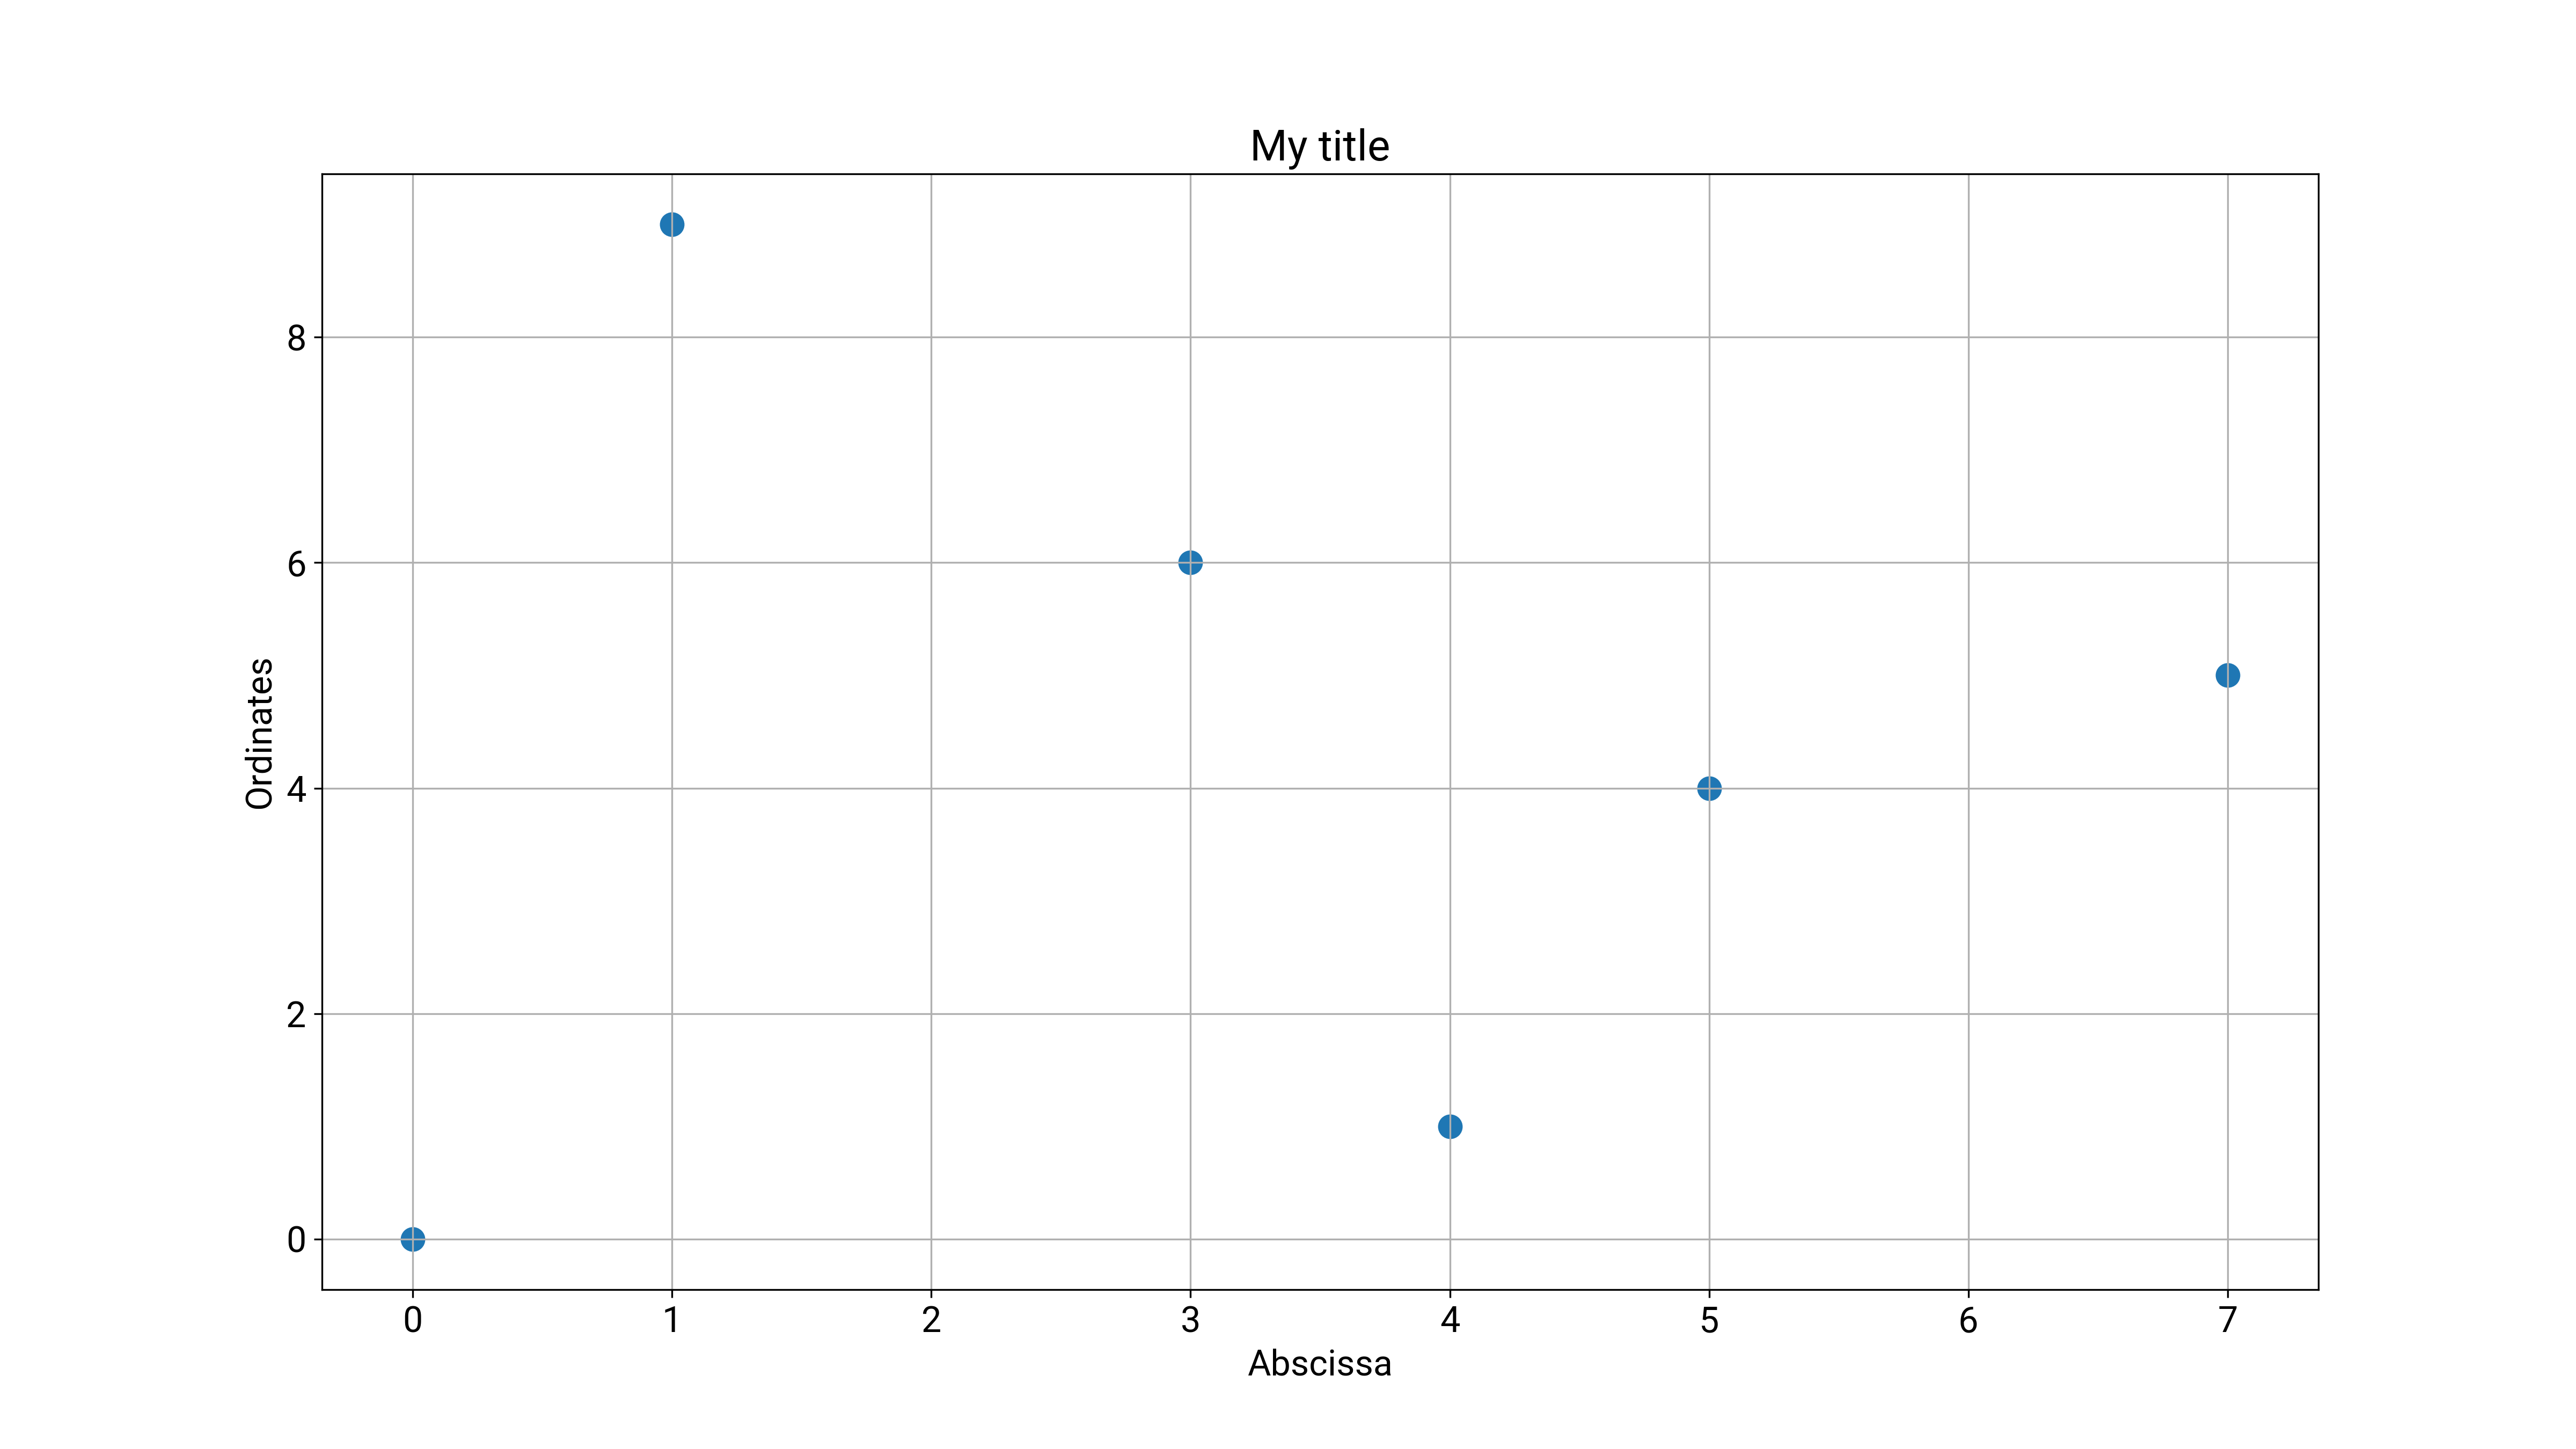
At first, I create a small dataset for creating an example plot:
import pandas as pd
import matplotlib.pyplot as plt


df = pd.DataFrame(
    {
        "A": [1, 5, 7, 3, 4, 0],
        "B": [9, 4, 5, 6, 1, 0],
    }
)


plt.rcParams["font.size"] = 16
plt.figure(figsize=(16, 9))
plt.xlabel("Abscissa")
plt.ylabel("Ordinates")
plt.title("My title")
plt.scatter(df["A"], df["B"], s=100)
plt.grid()
plt.savefig("plot_example.png", dpi=300)

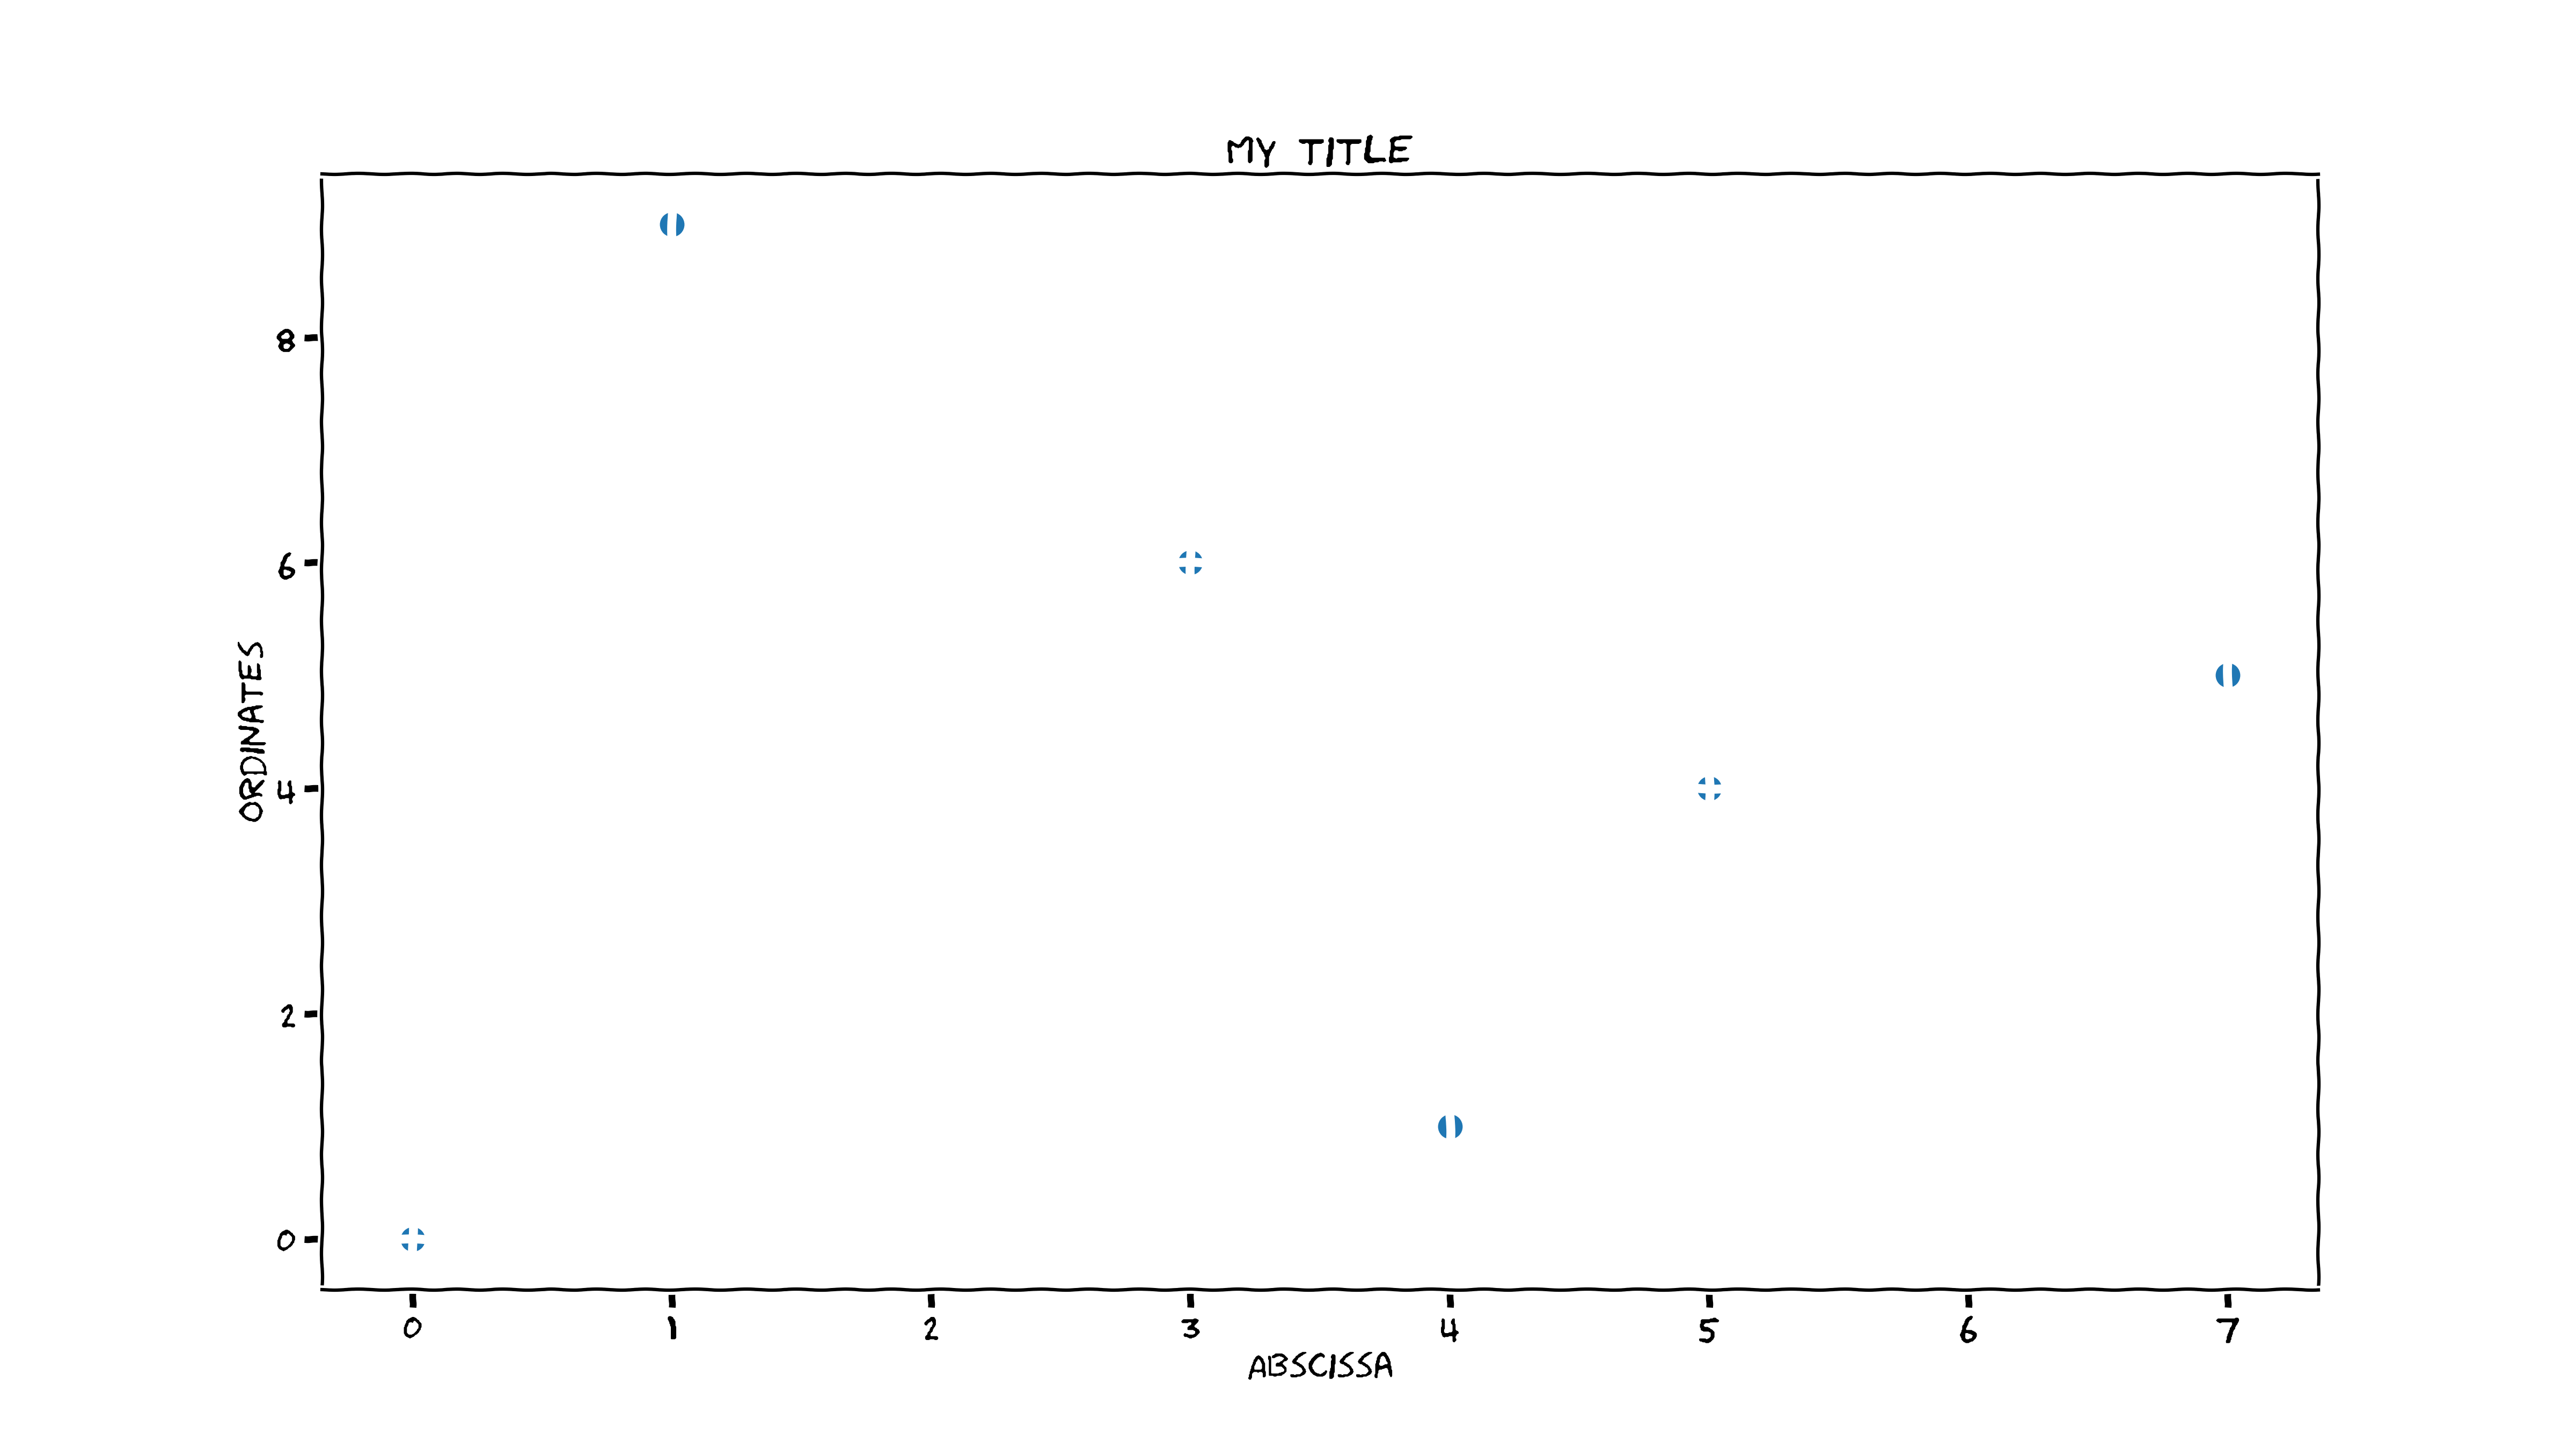
I know, this is boring. It is just that I do not dare to consider as a reference style the following xkcd-like:
with plt.xkcd():
    plt.rcParams["font.size"] = 16
    plt.figure(figsize=(16, 9))
    plt.xlabel("Abscissa")
    plt.ylabel("Ordinates")
    plt.title("My title")
    plt.scatter(df["A"], df["B"], s=100)
    plt.grid()
    plt.savefig("plot_example_xkcd.png", dpi=300)
findfont: Font family 'xkcd' not found.
findfont: Font family 'xkcd Script' not found.
findfont: Font family 'Humor Sans' not found.

Unfortunately, I got the following error:
findfont: Font family 'xkcd' not found.
I found on Stackoverflow how to get the list of available fonts:
import matplotlib.font_manager
from IPython.core.display import HTML


def make_html(fontname):
    return "<p>{font}: <span style='font-family:{font}; font-size: 24px;'>{font}</p>".format(
        font=fontname
    )


code = "\n".join(
    [
        make_html(font)
        for font in sorted(
            set([f.name for f in matplotlib.font_manager.fontManager.ttflist])
        )
    ]
)
HTML("<div style='column-count: 2;'>{}</div>".format(code))
Resulting in the following result:
DejaVu Sans: DejaVu Sans
DejaVu Sans Display: DejaVu Sans Display
DejaVu Sans Mono: DejaVu Sans Mono
DejaVu Serif: DejaVu Serif
DejaVu Serif Display: DejaVu Serif Display
STIXGeneral: STIXGeneral
STIXNonUnicode: STIXNonUnicode
STIXSizeFiveSym: STIXSizeFiveSym
STIXSizeFourSym: STIXSizeFourSym
STIXSizeOneSym: STIXSizeOneSym
STIXSizeThreeSym: STIXSizeThreeSym
STIXSizeTwoSym: STIXSizeTwoSym
Ubuntu: Ubuntu
Ubuntu Condensed: Ubuntu Condensed
Ubuntu Mono: Ubuntu Mono
cmb10: cmb10
cmex10: cmex10
cmmi10: cmmi10
cmr10: cmr10
cmss10: cmss10
cmsy10: cmsy10
cmtt10: cmtt10
I follow this other post to install the fonts-humor-sans fonts together with roboto:
sudo apt-get install fonts-humor-sans
sudo apt-get install fonts-roboto
Then, I delete the matplotlib cache:
rm -r ~/.cache/matplotlib
I restart my Jupyter notebook, and check against the newly available fonts. On a Debian Machine, I got the following lines (notice the presence of the new fonts):
code = "\n".join(
    [
        make_html(font)
        for font in sorted(
            set([f.name for f in matplotlib.font_manager.fontManager.ttflist])
        )
    ]
)
HTML("<div style='column-count: 2;'>{}</div>".format(code))
C059: C059
D050000L: D050000L
DejaVu Math TeX Gyre: DejaVu Math TeX Gyre
DejaVu Sans: DejaVu Sans
DejaVu Sans Display: DejaVu Sans Display
DejaVu Sans Mono: DejaVu Sans Mono
DejaVu Serif: DejaVu Serif
DejaVu Serif Display: DejaVu Serif Display
Droid Sans Fallback: Droid Sans Fallback
FontAwesome: FontAwesome
Humor Sans: Humor Sans
Latin Modern Math: Latin Modern Math
Latin Modern Mono: Latin Modern Mono
Latin Modern Mono Caps: Latin Modern Mono Caps
Latin Modern Mono Light: Latin Modern Mono Light
Latin Modern Mono Light Cond: Latin Modern Mono Light Cond
Latin Modern Mono Prop: Latin Modern Mono Prop
Latin Modern Mono Prop Light: Latin Modern Mono Prop Light
Latin Modern Mono Slanted: Latin Modern Mono Slanted
Latin Modern Roman: Latin Modern Roman
Latin Modern Roman Caps: Latin Modern Roman Caps
Latin Modern Roman Demi: Latin Modern Roman Demi
Latin Modern Roman Dunhill: Latin Modern Roman Dunhill
Latin Modern Roman Slanted: Latin Modern Roman Slanted
Latin Modern Roman Unslanted: Latin Modern Roman Unslanted
Latin Modern Sans: Latin Modern Sans
Latin Modern Sans Demi Cond: Latin Modern Sans Demi Cond
Latin Modern Sans Quotation: Latin Modern Sans Quotation
Lato: Lato
MathJax_AMS: MathJax_AMS
MathJax_Caligraphic: MathJax_Caligraphic
MathJax_Fraktur: MathJax_Fraktur
MathJax_Main: MathJax_Main
MathJax_Math: MathJax_Math
MathJax_SansSerif: MathJax_SansSerif
MathJax_Script: MathJax_Script
MathJax_Size1: MathJax_Size1
MathJax_Size2: MathJax_Size2
MathJax_Size3: MathJax_Size3
MathJax_Size4: MathJax_Size4
MathJax_Typewriter: MathJax_Typewriter
MathJax_Vector: MathJax_Vector
MathJax_Vector-Bold: MathJax_Vector-Bold
MathJax_WinChrome: MathJax_WinChrome
MathJax_WinIE6: MathJax_WinIE6
Nimbus Mono PS: Nimbus Mono PS
Nimbus Roman: Nimbus Roman
Nimbus Sans: Nimbus Sans
Nimbus Sans Narrow: Nimbus Sans Narrow
Noto Mono: Noto Mono
Noto Sans Mono: Noto Sans Mono
P052: P052
Roboto: Roboto
Roboto Condensed: Roboto Condensed
STIXGeneral: STIXGeneral
STIXNonUnicode: STIXNonUnicode
STIXSizeFiveSym: STIXSizeFiveSym
STIXSizeFourSym: STIXSizeFourSym
STIXSizeOneSym: STIXSizeOneSym
STIXSizeThreeSym: STIXSizeThreeSym
STIXSizeTwoSym: STIXSizeTwoSym
Standard Symbols PS: Standard Symbols PS
TeX Gyre Adventor: TeX Gyre Adventor
TeX Gyre Bonum: TeX Gyre Bonum
TeX Gyre Chorus: TeX Gyre Chorus
TeX Gyre Cursor: TeX Gyre Cursor
TeX Gyre Heros: TeX Gyre Heros
TeX Gyre Heros Cn: TeX Gyre Heros Cn
TeX Gyre Pagella: TeX Gyre Pagella
TeX Gyre Schola: TeX Gyre Schola
TeX Gyre Termes: TeX Gyre Termes
URW Bookman: URW Bookman
URW Gothic: URW Gothic
Z003: Z003
cmb10: cmb10
cmex10: cmex10
cmmi10: cmmi10
cmr10: cmr10
cmss10: cmss10
cmsy10: cmsy10
cmtt10: cmtt10
dsrom10: dsrom10
esint10: esint10
eufm10: eufm10
msam10: msam10
msbm10: msbm10
rsfs10: rsfs10
stmary10: stmary10
wasy10: wasy10
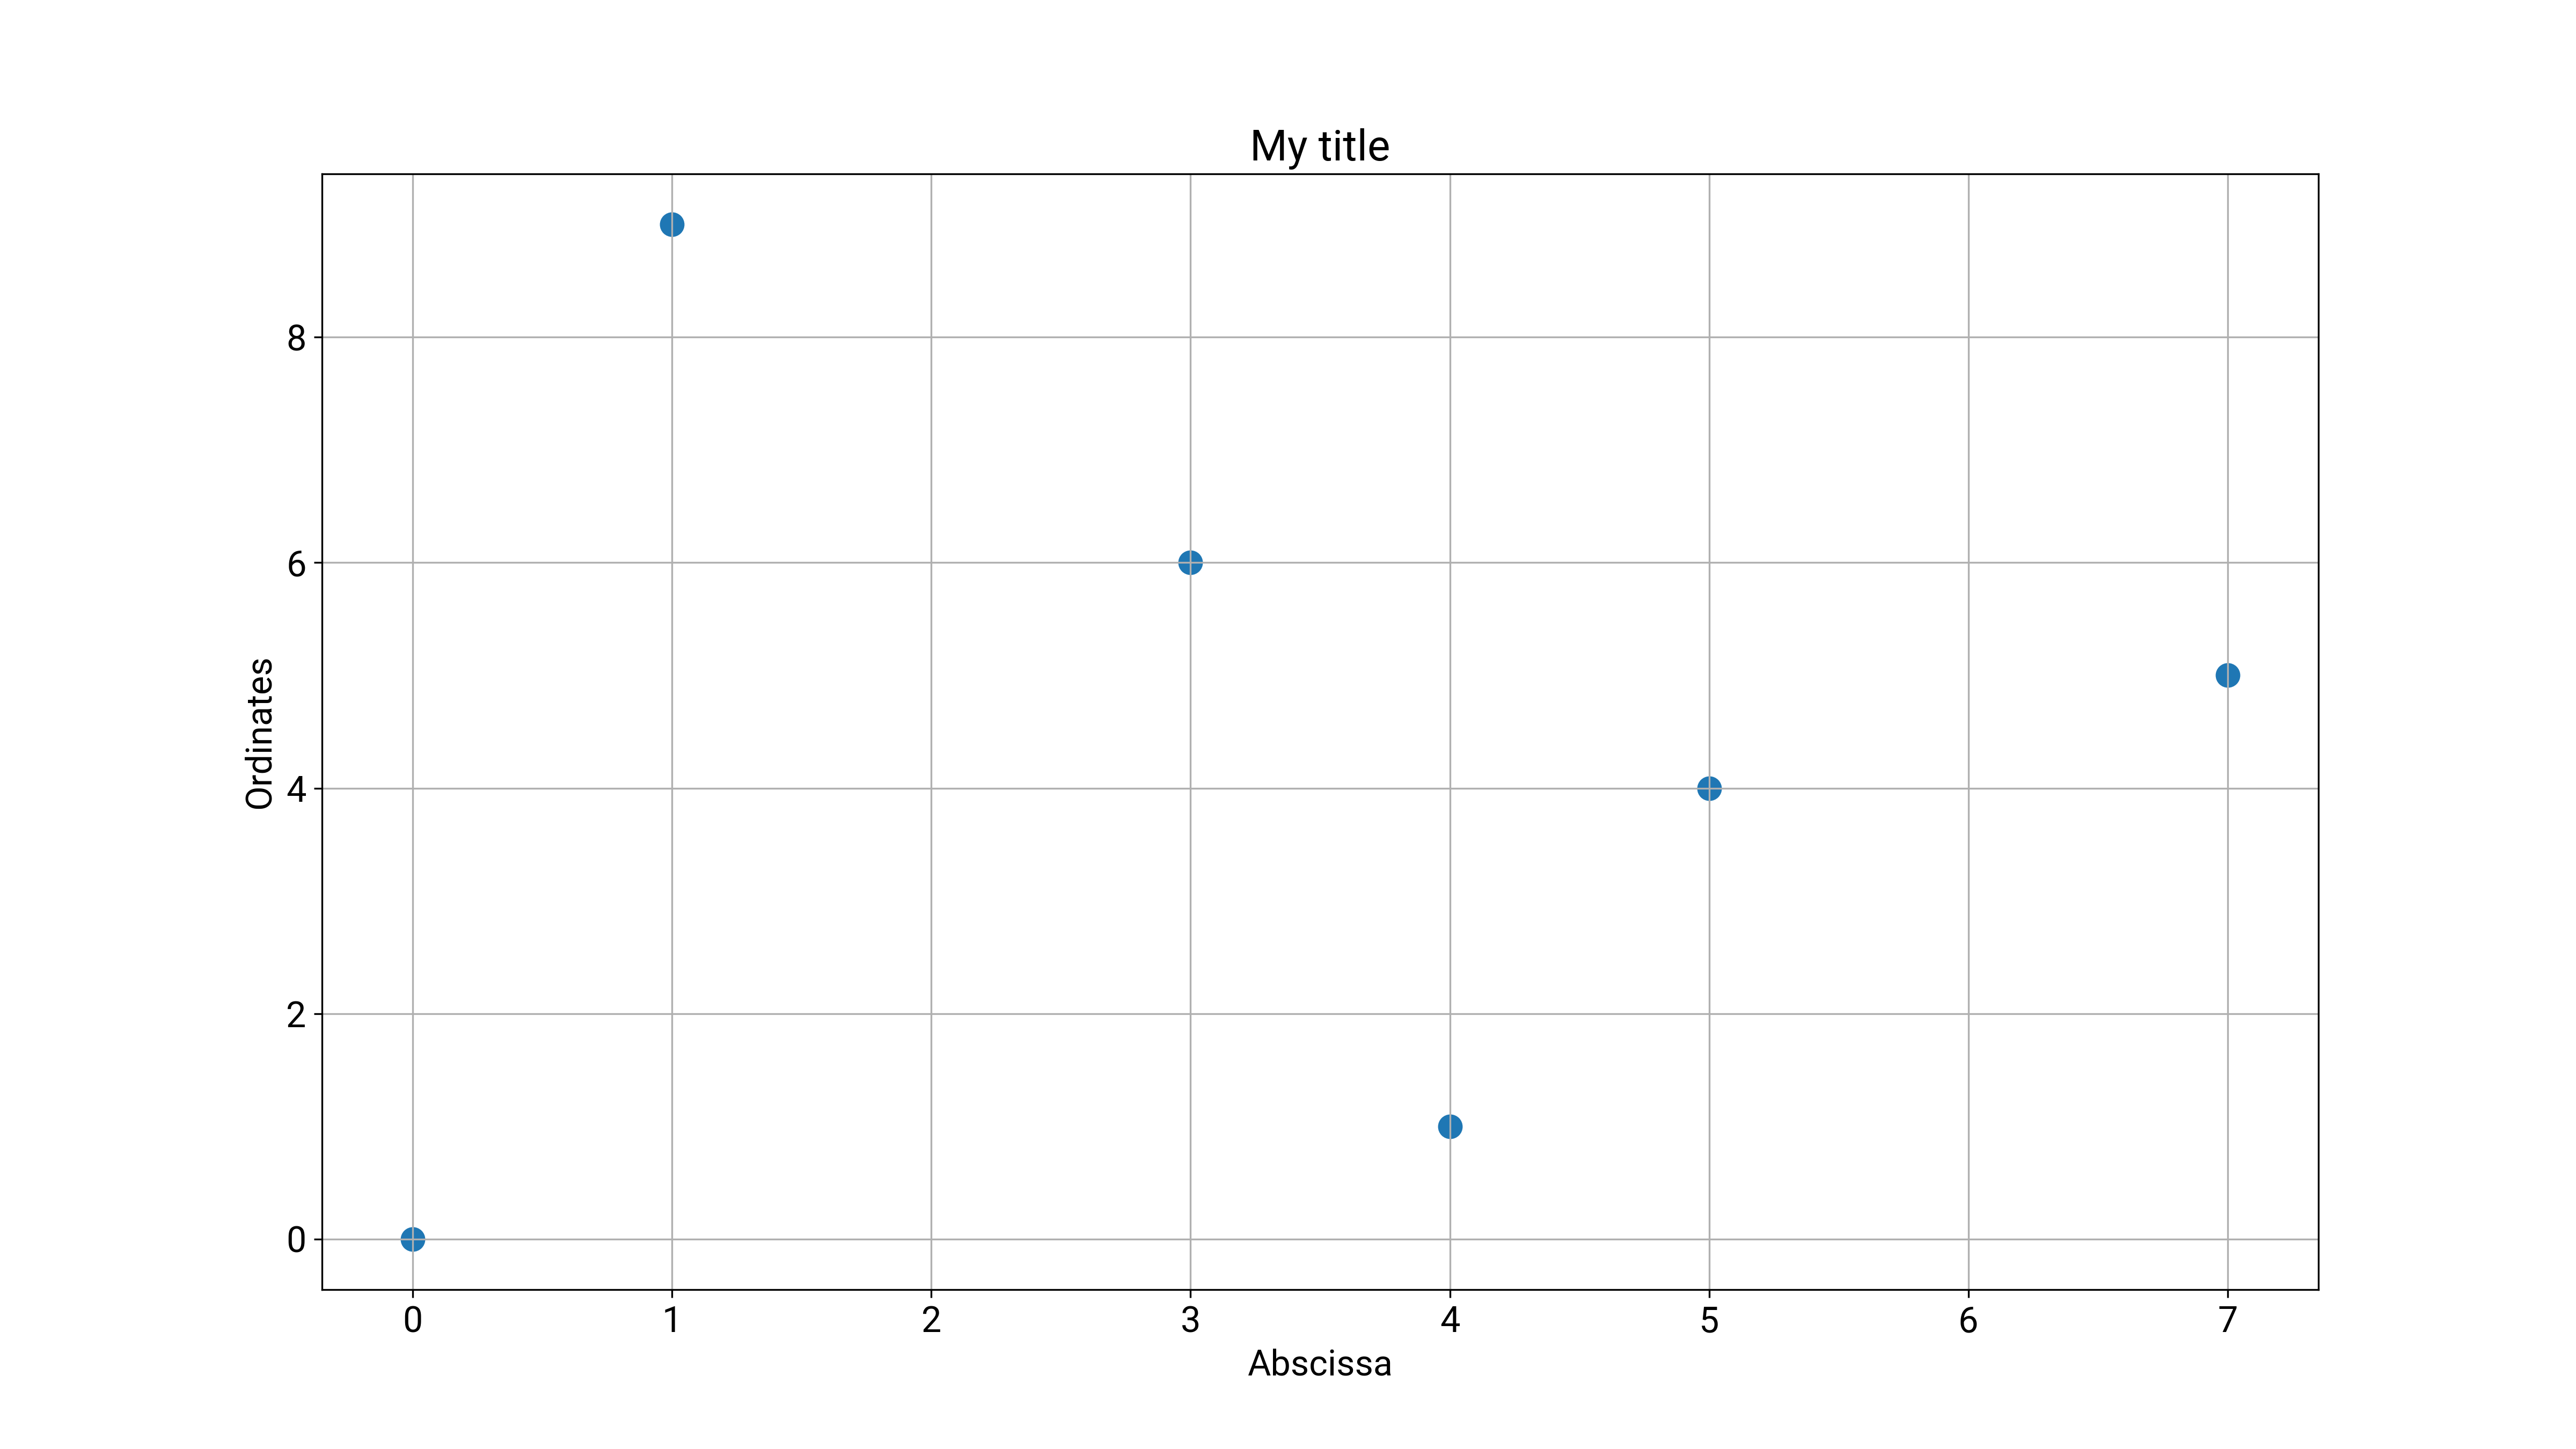
Then, I produce the same plot using the Raboto font:
plt.rcParams["font.size"] = 16
plt.rcParams["font.family"] = "Roboto"


plt.figure(figsize=(16, 9))
plt.xlabel("Abscissa")
plt.ylabel("Ordinates")
plt.title("My title")
plt.scatter(df["A"], df["B"], s=100)
plt.grid()
plt.savefig("plot_example_roboto.png", dpi=300)
obtaining:

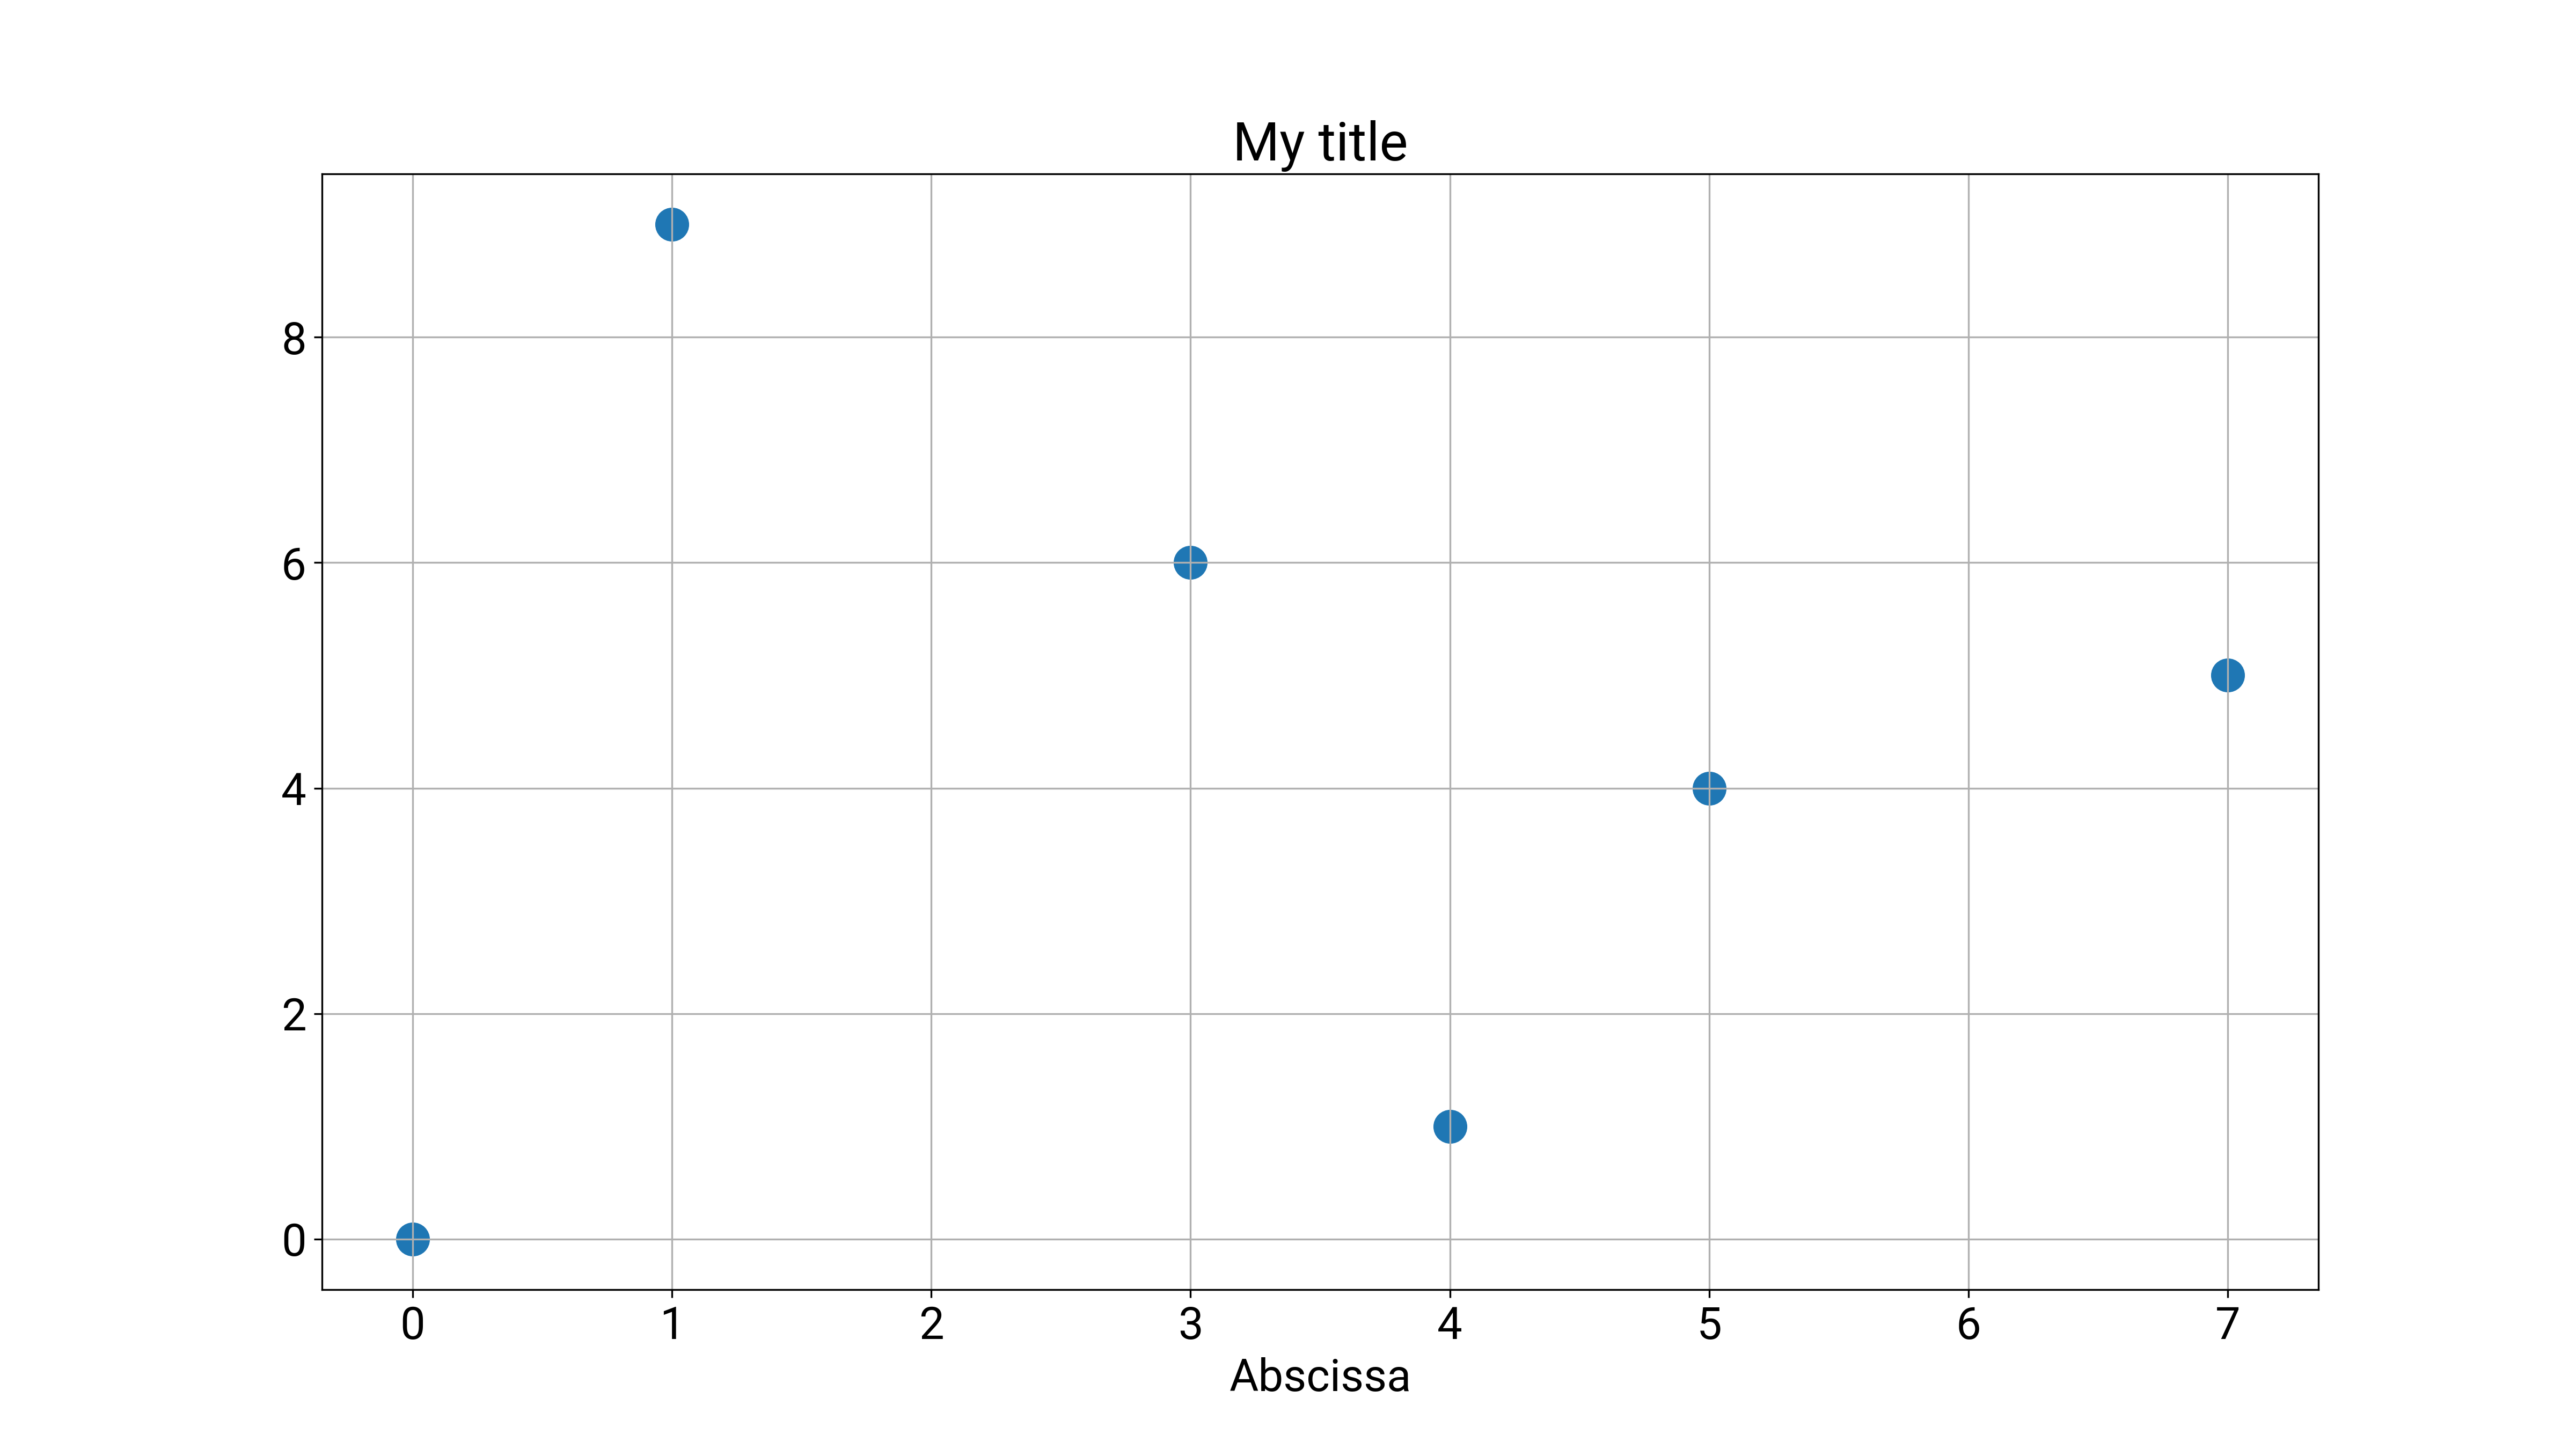
I increase the fonts (to size 20) in the plot to increase readability; I remove the label on the ordinate axis for not forcing the reader to an effort in reading a rotated text. The result is the following:
